We have chosen to focus our analysis on the ADNIMERGE and UPENN CSF datasets. The ADNIMERGE dataset contains data from 1784 unique patients across multiple ADNI protocols and several dozen of the most widely studied clinical variables relevant to dementia. These include demographic data such as age, race, and gender; cognitive assessment scores from tests such as CDR and MMSE; ApoE genotype; and neuroimaging analyses such as average PET signals and estimated brain volumes from MRI. The outcome of interest is dementia diagnosis in one of three categories: normal (CN), possible/subclinical dementia (MCI), and dementia (AD) (the original DX_bl column contains diagnoses in five categories which were collapsed into these three as follows: CN+SMC=CN, LMCI+EMCI=MCI, dementia=AD). Our analysis focuses only on data collected at each patient’s baseline visit in order to simplify interpretation and to build a model that can predict disease status based on a single clinical snapshot without requiring follow-up visits, a significant barrier to timely and efficient diagnosis.
The UPENN CSF dataset adds additional information on the measurements of key neuro-substances implicated in AD and found in the cerebrospinal fluid (amyloid beta, TAU, and p-TAU). These CSF data are available for 1238 of the patients in ADNIMERGE. Although not yet adopted in standard practice, these measurements have been shown to contain predictive value in AD diagnosis. In initial cleaning of the CSF dataset, we chose to use ‘median’ values which represent a summary of CSF measurements across multiple batches. In combining this CSF data with ADNIMERGE, we merged on patient ID (RID) for all baseline observations in each dataset.
Exploratory Data Analysis
In EDA, we examined the distribution of select variables hypothesized to be important predictors of dementia across each diagnostic category. Each figure below is followed by a brief caption describing pertinent findings from EDA.
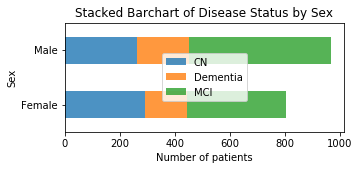
Demographic markers:
The distribution of disease status is fairly similar between males and females.
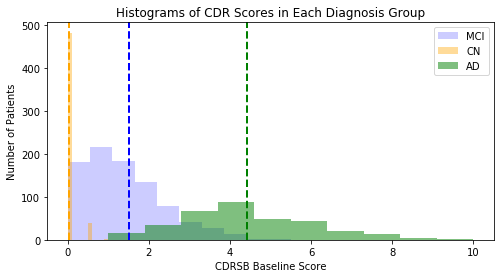
Cognitive Assessments:
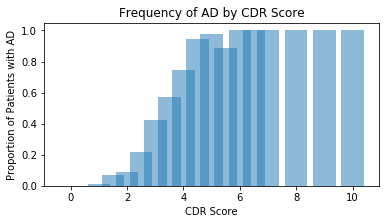
CDR Score is highly associated with AD.
All patients with CDR Score > 1 are diagnosed at least MCI, and scores >3 are more likely to earn a diagnosis of AD.
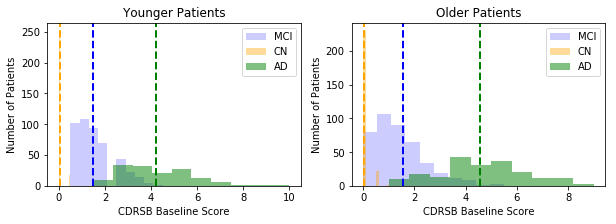
Graphing the same data as above but separately for younger patients (age<74) and older patients (age≥74) shows that CDR score has a similar association with diagnosis between age groups.
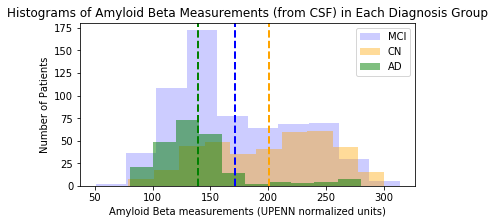
Overall, amyloid beta levels distribute bimodally. AD patients have a tighter distribution of A-beta measurements centered at the lower of the two modes, whereas MCI and CN patients have measurements across the spectrum.
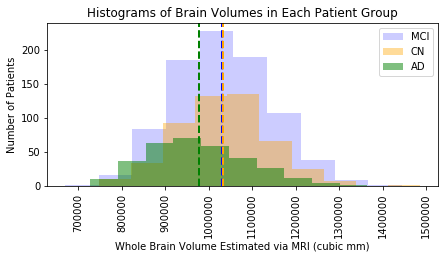
Imaging markers:
Although the distributions of brain volumes are wide, AD patients have a clearly lower mean brain volume than MCI or CN patients.
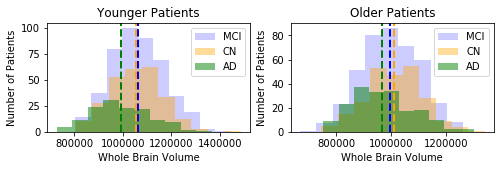
The difference in brain volume is evident in younger patients (age<74) but less clear in older patients (age≥74).
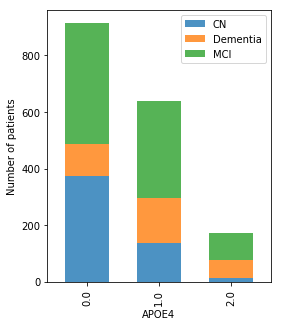
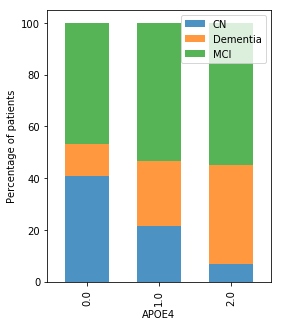
Genetic markers:
The ApoE4 allele is a classical genetic risk factor for AD. Classes 0, 1, and 2 correspond to the number of copies of the ApoE4 allele. The graphs above depict the same data on different scales (left - raw number of patients of each genotype with each disease status; right - percentage of patients of each genotype with each disease status). The graph on the left highlights the fact that class 0 (no ApoE4) is the most common genotype, and the number of patients of class 0 is approximately equal to the number of patients who are heterozygous or homozygous ApoE4, combined. The graph on the right shows that with increasing copies of ApoE4, prevalence of dementia increases while prevalence of normal status decreases.